Wednesday, November 20, 2013

A Hard Freeze and Modified Arctic Air Hits the Northwest

The air felt very different today.  Colder, drier and without a cloud in the sky.  And it was different, as we switched the  air mass over us from maritime polar to modified continental polar.    The result will be the first hard freeze over the region, with 20s being common west of the Cascade crest and teens in colder, valley locations.  Even colder in valley's east of the Cascade crest.


I am teaching atmospheric sciences 101 right now and the funny thing was that today my lecture was on air masses--large, relatively uniform blobs of air, thousands of km in dimension.

One air mass is continental polar: cold, dry air that forms over the arctic regions with a relatively uniform snow coverage...like Siberia and northern Canada.  This air mass generally doesn't make it to western Washington because of the dual blocking effects of the Cascades and Rockies.  This is the kind of air that often pushes southward into Montana, the Dakotas and the eastern two-thirds of the U.S. producing the frigid winter conditions they are famous for.

Another air mass is the one we normally "enjoy":  maritime, polar air that starts as continental polar over Siberia, but then is warmed and moistened at low levels by the relatively warm waters of the Pacific Ocean.  This air mass is mild, wet, and modestly unstable, with lots of shower activity.   This is the air mass with our number on it, since our weather generally comes from the west.

But yesterday, something interesting happened.  A large ridge over the eastern Pacific helped build a cold high pressure system over the Yukon and northern B.C., and then pushed this cold air southward across the Northwest U.S.   Our winds switched to northerly, temperatures and dew points dropped, and the clouds melted away.  The leading edge of the cold air is often called the arctic front by local meteorologists.   We generally don't get the super-primo continental polar air because the Cascades and Okanogan terrain
keep the coldest air in B.C..

Let me illustrate all of this.  Here is the forecast map of sea level pressure, surface winds, and lower atmosphere (about 3000 ft up) at 4 PM today (Wednesday).  The purple and blues are cold air.   You see the big pressure gradient at the leading edge of the cold air?  Classic with an arctic front.

Last night was the first after the arctic front passage, and temperatures were noticeably cooler, with lots of freezing temperatures.  But tonight (Wed/Thurs) will be much colder.

Here are last night's minimum temperatures over western WA. Forties near the water.  Then low to mid-30s a bit away from H2O.  But farther away from the water (like over east-side communities, SW Washington, etc.) there were lots of mid-20s.  Move up into mountain valleys and teens were all over the place.


Like colder temperatures? No problemo.  Look at NE Washington (see below).  Lots of reports in the teens and single digits.

It will be much colder tonight (Wed/Thurs) since colder air is in place and the winds will be much lighter...thus less mixing of warmer air above.  As of 9 PM Wednesday, regional temperatures were running 5-7F less than last night.

Bottom line:  if you have any sensitive plants, particularly those in planters, you might want to cover them or bring them into a warmer place.  Your tomatoes will be dead if any are still alive.

The probability of temperatures below freezing produced by the UW probcast forecasting system is shown next.  Red and orange are pretty much certain (80% or higher probability).  That is most of you.  Only coastal areas have  a chance of missing out on the chilly fun.

And here is probcast's predictions of minimum temperature.  Around 25-26 F in Seattle.  Lots of teens east of the Cascades.

And if you like to follow the cold temperatures around Seattle in real-time, including being able to see actual road surface temperatures as well, check out Seattle SnowWatch.  Here are the latest temps (9:16 PM Wed).  Blues indicate freezing and below.  Lots of air temperatures (all at roughly 2-meters above the surface) in the 20s and subfreezing.  Much cooler on the eastside. The road temps (in rectangular boxes) are all above freezing right now, but they will slowly cool during the night.  Quite some contrasts:  42F near the water downtown to 27F in Woodinville.  15F.   The contrast will be more extreme by daybreak.

By the way, looking for the perfect holiday at a modest price for the weather lover in your household.  Look no longer!  Students in my department, in concert with King-TV, have produced a Washington Weather Calender.   Some of the proceeds goes to help support the UW student chapter of the American Meteorological Society, including helping them go to conferences.  A good calendar with lots of local weather information, for a good cause.  You can purchase them ($14.99 plus shipping) online here. 
I bet you thought I was going to mention my book on Northwest weather.


Monday, November 18, 2013

Coastal Ocean Acidification: Answering the Seattle TImes

A few weeks ago, I blogged about the Seattle Times series on coastal ocean acidification, which dealt with supposedly “lethal,” “corrosive” coastal waters that were killing oyster larvae in some commercial hatcheries a few years ago.  

The ST suggested that mankind’s emission of CO2 was having profound effects today on shellfish in Northwest waters.   I argued that the ST story was exaggerating the current impacts of CO2 increases and neglected a key point: that the short periods of lowered ph (a measure of acid/base ) were predominantly caused by natural variability.  The truth is that mankind's CO2 emission is actually a very minor player in the current problems at local oyster larvae hatcheries.


The response of the Seattle Times to my blog was rapid and pointed.  They put up a page on their glossy “Sea Change” web portal saying that my blog “ignores the science”  (see above for a sample) and refused to allow me to submit a response that would also be available on their site.

Unfortunately, none of their response to my blog dealt with the scientific questions I raised, rather their defense was that they had talked to the experts.  I had a nice conversation with Danny Westneat, one of the few ST staffers with a science background (B.S. Chemistry).  But he wasn't interested in talking scientific details either.  Just process.

Industrial aquaculture on Puget Sound:  Thousands of plastic tubes for propagating geoducks  
Not exactly a pristine setting.

Over the past weeks I have done extensive additional research, including talking to UW specialists in coastal oceanography and ocean acidification, as well as several individuals in the local shellfish industry.  I have received nearly 50 emails and comments and more than a dozen calls.  Many, including academic researchers and industry insiders, told me I got the facts right. The additional information I have secured has solidified my conclusion that the ST article strayed from key facts and avoided mentioning information that did not fit well with their “story.”   The true story is far more complex and nuanced than the ST article suggests.   

In this blog, I will go substantially beyond my previous note, with more technical detail and scientific evidence.  You judge for yourselves where the truth lies.
 
Where are the “lethal” waters?

            The Seattle Times emphasized the “lethal” waters that were killing shellfish, particularly oyster larvae.  But the truth is that native shellfish species living in our waters have been doing fine.  In fact, even non-native species growing in our natural aquatic environment have been doing well.    


The problem was limited to factory aquaculture of non-native species.   Or to put it more exactly, limited to big tanks containing oyster larvae of non-native Pacific oysters from Japan.  Oyster larvae that could not reproduce in our cold waters, with or without any extra CO2.  The problems only occurred in these oyster larvae factories during short periods during summer when there was strong upwelling of coastal waters-when cold, high-CO2 waters located at depth were lifted towards the surface as a result of stronger than usual northerly winds.

To put it another way, the “lethal” waters described in the Seattle Times article are found here:


And NOT here:

That puts a different edge on the issue, doesn't it?  As I will discuss later, the  oyster larvae factories (located on Washington and Oregon coastal bays) no longer have a problem with oyster larvae death.  The problem has been essentially solved.  And let me say this again:  the shellfish industry is using a non-native oyster species that can’t reproduce successfully here in the NW because our waters are too cold.  That is why they have to artificially hatch the larvae in warmed waters in commercial plants.

Aragonite versus ph

Some of the Seattle Times critics of my blog complained that I did not talk about aragonite, a measure of the amount of carbonate ions in the water;  the reason I did not do so was because the ST article did not talk about it.  But let’s do so here.

The shells of oysters, clams, and the like are made up mainly of calcium carbonate (CaCO3) and are sensitive to the concentration of carbonate ions in the water.   The reaction of CO2 with seawater reduces the availability of carbonate ions (CO3).  At the same time, CO2 also decreases the ph.  A measure of the availability of carbonate ions is the aragonite level (indicated by the Greek letter Omega).  When the aragonite level is greater than one there is supersaturation of carbonate (good for shell formation), when less than one the water is undersaturated and it is harder for shellfish to build shells.  As shown in many studies, there is a close relationship between ph and aragonite levels:  as the ph of water goes down (less basic), the aragonite level declines.  The paper by Barton et al. 2012 illustrates this very close relationship between ph and aragonite level  during a summer month they studied (see below).  No one is going to argue with that.  


 Ph and aragonite levels at  Oregon's Netarts Bay, 01 June–03 August 2009.  Notice how closely they follow each other.

Natural variability.
            An essential point I am making is that natural variability in acidity/ph (and thus aragonite level) in Northwest coastal waters is FAR, FAR larger TODAY than the contribution by human-injected CO2 in the atmosphere.  The problem in the hatcheries were first noticed in 2006 during which the die-offs of oyster larvae only occurring during strong upwelling periods, when high pressure off the coast produces strong northerly winds that caused cool, low-ph water to rise towards the surface.  

In 2009, a field experiment (published in Bartons et al 2012) took detailed measurements of water from Oregon’s Netarts Bay at one of the hatcheries (see figure above).  As you can see from that figure, ph varied from nearly 8.2 to 7.6 (about .6 ph units).  You will also notice there were huge daily swings of ph of around .4;  this is due to photosynthesis during the day reducing the CO2 levels and thus increasing ph.  This point is important…keep it in mind for later.  The Barton et al paper and several others document the fact that the periods of lowest ph level are associated with times of strong upwelling.

            So how much of the low ph is is associated with human-connected CO2?  If the Seattle Times is right, then humans are making a substantial contribution to low ph and the "lethal" factory waters.   We can calculate this.  

The low ph periods only occur during periods of coastal upwelling.  According to a highly quoted paper by Feely (Science 2008), the upwelled waters were last in contact with the atmosphere about 50 years.   A local physical oceanographer told me 40 years, so let’s be  conservative and assume 40 years ago (1971).  Atmospheric CO2 levels were much lower then compared to now (400 ppm now, versus 325 then--see graph below to prove this).   A number of studies (including
Feely) have suggested that general pre-industrial levels of


open ocean ph were about .1 lower than today.  Before industrial society, the CO2 level was about 280 ppm, about 45 ppm less than in 1971.   So let's assume that the upwelled waters today were exposed to 1971 levels of CO2.  So it is very reasonable to assume that the contribution of human-produced CO2 levels to the ph change today in upwelled waters is thus (45 /120)*.1 or .0375.   Let’s round that up to .04.   

Consider the implications of this.  The lowest ph observed that (2009) summer (7.6), would have been 7.64 without human CO2.  Doesn’t seem like such a headline grabber does it?   To but it another way, human CO2 impact is 6.6 % (.04/.6) of the natural variability observed that summer.

To put this in further perspective.   Imagine a heat wave in which the temperatures are 20F above normal one day.   Imagine that CO2 increases explained 6.6% of that.  This would be 1.32F.  The heat wave was made slightly worse, but the heat wave would have happened with or without the CO2.  

Later in the century the story will be different.   In 50 years, human impacts on ocean acidification will be twice as large—still smaller than natural variability, but more significant.

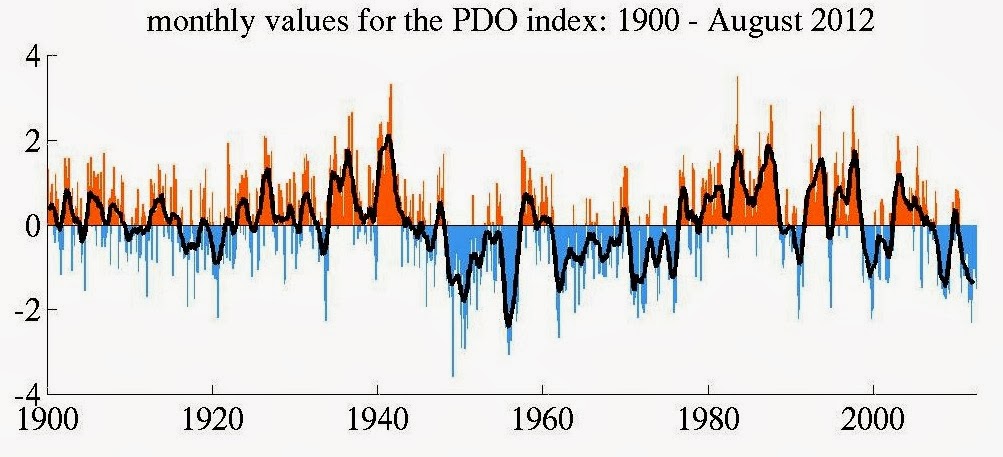
And why did problems start in 2006?  One potential reason:  a source of natural variability in Pacific Ocean circulation, the Pacific Decadal Oscillation  (PDO) had just switched into its cold phase after being in a warm phase since the late 1970s.  2006 was also a very strong upwelling year.


The lethal water problem is solved

Joint efforts between scientists at Oregon State, the University of Washington, and NOAA PMEL helped solved the initial mystery of why the hatchery larvae were dying.  The oyster larvae in the factory tanks did not do well during upwelling periods of low ph and low aragonite levels.   And the solution was relatively easy.  The hatcheries were pulling water in during the morning when ph was low.   They changed their procedures to acquire water during the afternoon when ph was higher (natural photosynthesis during the day pulls CO2 out of the water) and that seemed to solve the problem.   Some oyster larvae factories also enhanced the carbonate levels by adding some chemicals.    So the Seattle Times is trying to make a headline story of a very small issue that has been alleviated by improved factory procedures.

The Puget Sound environment: a very different world


As noted in research such as Feely et al 2010 (Estaurine, Coastal, and Shelf Science, 88, 442-449) the ph and argonite level situation is very different in inland bodies of water like Puget Sound.   They note that in the shallow surface waters of inland Washington there was no problem during the summer (e.g., August 2008) with the aragonite (calcium carbonate ions) being saturated or supersaturated everywhere (good for shellfish).  The waters were not hitting the lower phs observed on the coast.   This is to be expected considering that deep coastal waters with low ph can only get inland in the deeper subsurface waters.  In the shallow inland waters, photosynthesis, warmer temperatures, and different water origin keep things fine for oysters and other shellfish.  That is why the oyster larvae can be transferred to beds in Puget Sound to grow big and fat.  


Furthermore, Feely et al and other papers document that there are other human-related factors in Puget Sound the can influence ph and oxygen levels, like nitrogen-rich effluent from farms, sewage, and other origins.   Or the impacts of heavy precipitation and intense river outflows.  Not so simple.  Even more so than on the coast, human enhanced CO2 levels in the atmosphere is a very minor player in the ph and aragonite levels in Puget Sound and other inland waters.

Factory Shellfish Farming:  Do they bring environmental risks?


The Northwest shellfish industry is big business:  according to a NOAA website, this industry brings in an estimated 170 million dollars a year into the NW economy and employes more than 3000 people.   Some of the environmental practices of this industry are of concern.  For example, they have sprayed large amounts of the insecticide carbaryl on wetlands to kill burrowing shrimp and other industry pests (see their permit information here).  This chemical is a likely human carcinogen (see EPA statement).  To quote a letter by oyster expert John McCabe:


The destruction of two native crustacean species, the ghost shrimp,Callianassa sp., and the mud shrimp,Upogebia sp.,with the pesticide Carbaryl, for the sake of facilitating the production of the invasive species Crassostrea gigas (Japanese or Pacific oyster), has long been practiced on Willapa Bay


Some oyster farmers use carbaryl pesticide to kill burrowing shrimp on their oyster beds because the sediment the shrimp excavate smothers and buries oysters

And after killing off these crustaceans, eel grass is growing unchecked by natural predators, so the shellfish folks are spraying herbicides such as Imazamox.  As shown in the first photograph in this blog, there is the massive use of plastic in the Puget Sound beach environment--another concern. There are environmental groups that are trying to bring such chemical applications and other issues connected with shellfish aquaculture to the attention of local citizens and the State, one example is Protect our Shoreline.

Eelgrass, Willapa Bay

Why did the Seattle Times tell only part of the story?

The Seattle Times article did not concern itself with the environmental impacts of the large shellfish industry?  Why?   I believe the reason is that it did not fit  their "story" that human-enhanced CO2 in the atmosphere is the real villain.

And why did the Seattle Times focus on a very minor issue for oyster aquaculture (ocean acidification) and why did environmental activist groups jump on this story?    I suspect many of them are determined to find an acute example today of the impacts of growing levels of CO2 in the atmosphere.

The truth is that anthropogenic increases in CO2 are only having subtle impacts on our regional weather today, the big changes and impacts will occur decades into the future. Both global warming and ocean acidification are very serious issues and by the end of the century their impacts will be substantial.   But exaggerating and hyping the effects today are unacceptable.  Citizens and policy makers deserve the facts, not exaggerations designed to elicit the proper response.  Crying wolf in the end is counterproductive and undermines the credibility of science to promote the proper actions is unacceptable.

Hopefully, I have convinced you that this is a complex issue, one deserving of additional research.  We are fortunate, that with the support of the State, the UW has initiated an Washington Ocean Acidification Center, and in concert with local colleagues at NOAA PMEL, they hopefully can further unravel the science.


 From the Seattle Times web site.  Not stretching things too much.  Killing BILLIONS of oysters.

Saturday, November 16, 2013

Super Olympic Rain Shadow

Friday was a day of contrasts:  while the windward side of the Olympics were being slammed with several inches of precipitation at lower elevations with lots of snow aloft, it was nearly dry over parts of Kitsap County and Seattle.    Hard to believe, but true!  I biked to and from the UW Friday and did not feel a single drop.   However, strong, gusty winds almost blew me off the Burke Gilman trail on my way home.

Let's start with the 24-h precipitation totals ending 9 PM on Friday (see below).   A few hundredths of an inch over central Puget Sound, while a few dozen miles to the east along the western Cascade slopes some locations got more than 3 inches.   The origin?  A rain shadow in the lee of the Olympic Mountains.  If you look carefully you will see very light precipitation to the east of the mountains of Vancouver Island, which has its own rain shadow.

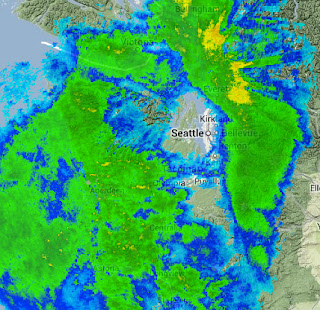
The radar-based precipitation for the same 24 hours from the Seattle RainWatch web site also clearly shows the rain shadow (see graphic)

As does a radar snapshot at around 3 PM Friday afternoon:

 The reason for this profound rain shadow to the east of the Olympics?   We have quite strong westerly flow over us, flow that was associated with a disturbance originating in the Gulf of Alaska.  To illustrate, here are the winds, temperatures, and heights of the 850 hPa pressure surface (about 5000 ft above the surface).   30-40 knot westerly to west-northwesterly flow hitting the Olympics. Where the winds take air upwards, you get enhanced precipitation.  Where the air is rapidly descending (east of the Olympics), precipitation is attenuated.  

The air still has water vapor in it even when precipitation is not falling;  as the air is forced again to rise (this time by the Cascade), torrential rain and snow results.

 High-resolution model forecasts knew such rain shadowing was coming.  Here is the precipitation forecast made on Thursday afternoon for the 24h precipitation ending 4 AM on Saturday by the UW WRF model.  Not perfect, but the essential pattern is there.

Very strong winds has moved into the Strait of Juan de Fuca late Friday behind the passing trough, with gusts to 50-60 miles per hour.  Here are the max winds for the 24-h ending 9 PM Friday.   Western Whidbey is being hit hard.


Thursday, November 14, 2013

Heavy Snow in the Mountains and Arctic Air Teases the Northwest

When will skiing begin in the Washington Cascades?  Is there a possibility for Thanksgiving skiing, at least on the cross country trails? 

You need to start the season with a good base, and during the next 48h the Cascades will get a nice 1-2 foot dump of powder.  Enough to make those folks in Utah and Colorado a bit envious.   And some cold Arctic air will push south into British Columbia, with some leakage flowing down the Fraser; perhaps, giving Bellingham and San Juan's a small taste of the cool, northeasterly flow that sets the flags waving at the Bell Faire Mall there.  

The fun will be associated with a trough moving southeastward along the eastern flanks of a huge ridge in the eastern Pacific (see graphic)
This trough is embedded in quite strong northwesterly flow.   A good pattern for snow around here...you get some precipitation but temperatures are cool enough for snow from pass levels to the Cascade crest.  

And now the exciting part.  Here is the predicted 48-h snowfall ending 4 AM on Sunday from the UW WRF model.  A lot of the Cascades will get 1-2 feet of snow if this is right.  Some higher elevations even more.   And this will not be any snow.  Decent powder.
The other interesting thing about this event is that quite cold air will be getting into British Columbia.  Take a look at the predicted surface air temperatures for Sunday at 7 AM.  You see those purples and whites?  Temperatures in the teens and below.  Not that far away!


As the trough moves through on Saturday, there will be a strong surge of westerly winds in the Strait of  Juan de Fuca and powerful northwesterlies down the Strait of Georgia (see graphic showing surface gusts  at  10 PM Friday evening).  50 kt winds approaching Whidbey!  And strong winds in the Cascades.   Be very careful if you are planning to cross a Cascade pass...it will be treacherous and dangerous.


And then by Saturday afternoon, modest northeasterlies coming out of the Fraser....a relatively weak case though (see figure). Still windy in the Strait of Juan de Fuca and in the Cascades.

But I have bad news for snow lovers.  By Tuesday, a warm, wet system will approach our coast (see map).  Freezing levels will move above the passes and rain will fall on the beloved powder.  Well, we like a nice Cascade concrete layer as a base....I guess.


Tuesday, November 12, 2013

Deploy Resources on Forecast, NOT on Disaster

Haiyan represents another human tragedy caused by severe weather.   And it highlights again the weakness in the way mankind responds to such disasters.

Days before Haiyan's landfall, the forecast models showed the threat.   Uncertainty was low as the best models honed in on the solution.  Some warnings went out, but the major players waiedt until death and destruction occured before initiating a major response.  The storm hit, victims were injured and desperate, and help did not begin arriving in force until 3-5 days after the event.  Many die, others sicken, looting begins, and the situation deteriorates until the second week after the storm.

Sounds familiar?  This kind of scenario is SO familiar, from Katrina to Haiyan and a many storms in between.

We can do much better.   Mankind, and particularly the U.S., needs to deploy on forecast, not deploy on disaster.  We can do this now for the simple reason that weather forecasts are hugely better than even a decade ago.   Sandy was a good example of our increased prediction prowess, and there are many more.  So why begin to deploy relief  AFTER the disaster strikes, but before?  And have the capability to move in with massive resources immediately after the storm passes.

Consider Supertyphoon  Haiyan.   Forecasts for landfall on the Philippines of an intense typhoon were made days before.  The best numerical weather prediction forecasts had stabilized on a very threatening solution early in the week.   For example, here are the 48 and 96 hr forecasts of sea level pressure and 850 hPa (aournd 5000 ft) wind speed for 48 and 96 hr before landfall from the European Center models.   Both forecasts had the right position for a very strong storm.  The threat was clear.


To quote Dr. Jeff Master's WeatherUnderground blog on December 5th, three days before landfall:

"Both the GFS and European models predict that Haiyan will hit the central Philippines between 3 - 6 UTC on Friday, and Haiyan will likely be the most dangerous tropical cyclone to affect the Philippines this year.

With a high probability of a huge supertyphoon heading for the extremely vulnerable Philippine coast, the world waited when it should have acted.

The U.S. decided to deploy the carrier George Washington and its group, which was  in Hong Kong, on November 11th, more than TWO DAYS after the storm hit.   According to Pentagon information it should take 48-72 hrs to be on station.   They should have deployed in the days before the storm's landfall, waiting a safe distance away until they could move in quickly.  Deployment of other aid should have begun at a similar, pre-landfall time.

Better late than never.

In many ways, aircraft carriers are the perfect delivery system for help in such events.  They are stand-alone cities with huge resources.  Helicopters and VTOL aircraft that can get into the most difficult conditions.  Large medical facilities.  The capability to hold vast supplies of food, water, generators, and other necessary equipment.  Unmanned and manned aircraft that can reconnoiter the damage and provide critical information. 

Let me go even further.  Imagine if three of the U.S. carrier groups were given the primary missions of providing relief for major disasters.  Yes, they would retain substantial armaments to be available for the national defense, but they would be supplied with massive supplies and experienced personnel to deal with  large disasters.   To push this idea further, one might station these carrier groups in three positions that might be most useful for disasters: off of SE Asia, NW of Africa, and in the Caribbean (I put C's at the suggested positions).   With two or more days warning for major storms, they could be in position in time.   For earthquakes, tsunamis, and volcanic eruptions they would move immediately after disaster strikes. Europe and Australians can take care of themselves.


 Can you imagine how many lives such an approach could save?  Can you imagine the good will it would engender for the U.S.?  Instruments of war being used as instruments to protect life and property around the world.   Too idealistic?  Perhaps.  Possible to do?  Without a doubt.

But carriers or not, my basic idea is simple.  Weather forecasts (and ancillary forecasts like waves and water level) have gotten much better during the past decades.  For most weather disasters, the 2-3 days forecasts will be very, very good.  If meteorologists believe uncertainty is low, then the U.S. government, UN agencies, non-governmental organizations, and other countries should begin deployment no less than 48h BEFORE weather disasters strike.  Have the capability to rush in help and supplies as soon as severe weather clears.

There is a lot of talk about the world having to deal with more severe weather under global warming.   But the "Inconvenient Truth" is that mankind is unable to handle the disasters of today.  Better forecasts, greater resources for disaster relief, and predeployment could have huge positive impacts for our fellow humans faced by terrible natural disasters.


Sunday, November 10, 2013

Are the forecasts too pessimistic for Veterans Day?

The official National Weather Service for western Washington tomorrow is favorable (sunny skies and temperatures in the mid to upper 50s), but are they being  too pessimistic?  Might tomorrow be much warmer and perhaps approach the record of 65F at Sea-Tac?

Perhaps.  For the University of Washington in Seattle the NWS forecast is 56F on Monday.

 The Weather Channel is 57F.

 But UW Probcast (making use of statistical postprocessing of UW ensemble forecasts) is going for 64F!


Let's take a look at the latest runs of the UW high-resolution (4-km grid spacing) WRF forecasts.  At 7 AM, it shows easterly flow and band of warmth in the Cascade foothills.  You know why that  warm band happens?  Downslope warming along the western slopes of the Cascades.

And at 4 PM.  WOW.  Lots of temperatures in the 60s, some in the mid-60s!

Now I would take the potential for a very warm day seriously.

A warm front is moving northward across our region right now (see map), with a low and  associated cold front approaching from the west.


Data above Seattle right now shows moderate southwesterly flow above us now, with temperatures greatly warming over the past 24 h (by 6C or 11F).
 With warm air above, the appearance of the sun, and strengthening easterly flow....a much warmer day is possible.  It got to 52F today with overcast.  Only a few degrees more with all the above going for it?    On the other hand, if more clouds come in than forecast, temps will remain in the 50s.  We shall see.  Would be a nice gift for the veterans.

And did I mention the winds?  The foothills may get blustery with moderate easterly flow (see graphic for tomorrow at 7 PM).


Saturday, November 9, 2013

Why is Northwest weather worst in November?

We are now entering the period of the year that is meteorological "ground zero" for the Northwest:  mid to late November.   By any measure, it is the windiest, wettest, and most difficult time of the year.  Storms return in vengeance, summer growth and remaining leaves result in more power outages, and the sudden arrival of clouds and darkness shocks even those accustomed to our NW climate.  Thanksgiving is expected to be a blustery wet time around here, with cooking turkeys on the grill a familiar act of desperation. Strangely enough, the statistics show that by early December the worst is over and there are subtle signs of improvement.  I know you don't believe that, but I will prove it in this blog.

Why is November so bad?   Why do things decline so quickly?  Why does our weather become less severe in December on average? 

First, some proof about November.  A fairly wet day is one that brings a quarter-inch of rain.   Here is the frequency of those events across the year at Seattle-Tacoma Airport (other locations in the area would have a similar variation).   The highest probability (about 35%) is during the third week of November.  Very rapid ramp-up between roughly October 15 and November 15th.   The switch is turned on.  And there is something startling:  the frequency of such wet days DECLINES in December. 


So why is mid to late November so bad?  The atmospheric fire hose, the jet stream, is headed directly into us!

The basic meteorological explanation of Northwest weather in November.

The jet stream is a strong current of winds, centered in the upper troposphere (roughly 25,000 to 35,000 feet above sea level), that is produced by the large difference in temperature between the subtropics and polar regions.  The temperature difference is concentrated in a relatively narrow region of the midlatitudes (a few hundred miles wide) and this concentration produces strong winds.  The one sentence explanation for this?  A big temperature gradient causes a large pressure gradient that results in strong winds.  All the rest is detail.

The jet stream weakens and moves northward during the summer, but during the fall the opposite happens:  it revs up and begins to move southward.   The jet stream is the conduit or pathway for major storms and such storms derive their energy from the strength of the jet stream (and associated temperature changes).  
 A graphic illustration of November

During August and September the jet stream is relatively weak and north of Washington and Oregon, but during November it strengthens and moves southward.  You guessed it, RIGHT OVER US.
During December and January the jet actually moves south of us on average, thus the fire hose is not over us at much and the weather improves.   Don't believe it?  Let me show you.  I am going to present the monthly mean wind speeds at 250 hPa--about 35,000 ft above sea level-averaged for the period from 1980-2010.    Colors indicate wind speeds (meters per second). Reds are the strongest winds.

In August the jet stream is north of us., with relatively light winds above our area.   Nice weather and few storms.
By October, things are different.  The jet, particularly over the Pacific, is much stronger and its extension over the West Coast has strengthened and moved south over southern British Columbia. This is when I should play the JAWS theme music.
 

But then November comes and the hose is directly over us.  Not was strong as in the central and western Pacific, but strong enough.
But look at December.  The jet over us has weakened (colors went from yellow to green) and has moved south of Seattle.

And by January the trend is clear.  The fire hose has moved south.


 By February, things are really different.  The jet is weaker and far south of the Northwest.  Our winter is over.

Not let me be clear.  These are mean charts for the month.  The jet stream on a particular day can be very different, bringing us a big storm in March or any other time.  But the typical variation of the strength and position of the jet stream explains why things get so bad here during November and why I am going to fill the propane tank for my grill today.  I am going to have warm turkey on Thanksgiving, power or not.


 The result of a strong jet stream